BIS published their annual ‘SET statistics’ last week, which provide a wealth of information on the UK’s investment in science, engineering and technology. The Campaign for Science and Engineering have published their take on the numbers. For me, one of the interesting aspects of the dataset is the reasonably long time series it provides, giving insights into long term trends. I compiled the following graph from the data to show how the general pattern of research investment has varied over time:
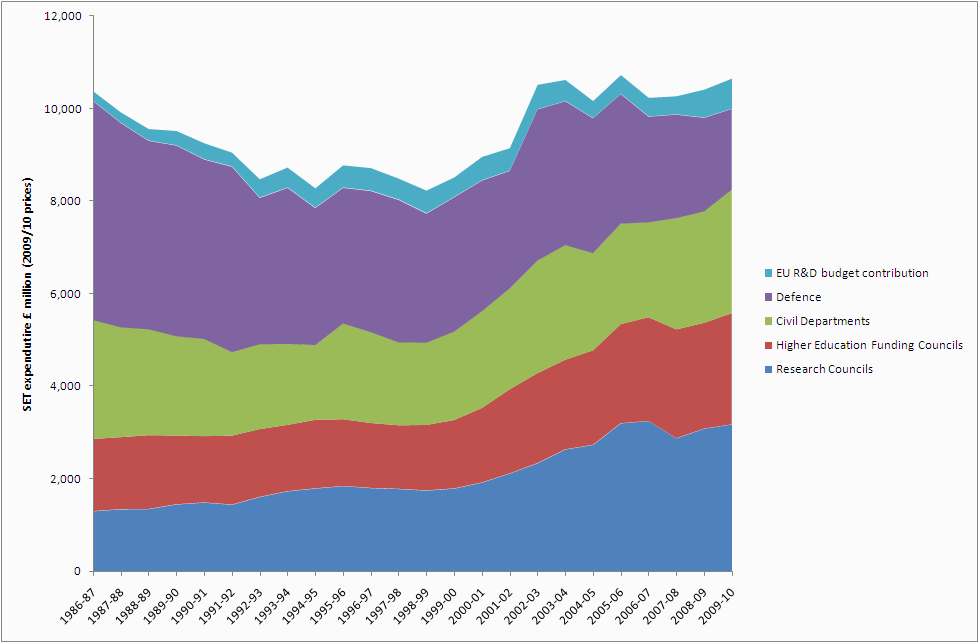
The investment levels are the inflation corrected figures, converted to 2009/10 prices. Some striking features of the patterns of investment are:
- In real terms, the investment in 2009/10 is equivalent to that of 1986/87. Total levels of investment have been reasonably constant in recent years.
- The changing pattern of investment has been towards increasing expenditure by the Research Councils and the Higher Education Funding Councils, largely at the expense of spending on defence. Spending by the civil departments has been steady and has increased slightly in recent years.
- Defence spending is more volatile than other areas with bigger year-on-year fluctuations.
I would be interested in your views on the statistics, so please comment.
